“Carbon dioxide is the biggest culprit, accounting for 72% of the global warming effect, followed by methane and nitrous oxide.”
Too much carbon in the atmosphere
Human activities are the main driver of climate change, mainly by burning fossil fuels such as coal, gas, and oil, with the energy sector, industries, transport, buildings, and agriculture as the biggest emitters of greenhouse gases.
According to the United Nations, the burning of these fossil fuels generates greenhouse gas emissions that wrap around the earth like a blanket, trapping the heat of the sun and resulting in raised temperatures. According to Prof Franke, it is important to mitigate climate change and prevent a global temperature rise of more than 1,5 degrees Celsius. According to the
Intergovernmental Panel on Climate Change (IPCC), we are looking at a temperature increase of around four degrees Celsius by the end of this century, if there are no drastic changes.
With an increase in global warming, we are expecting more disturbances in weather patterns, resulting in further extreme weather conditions such as droughts, floods, and extremely cold/hot conditions. Annually, millions of people lose their lives, livelihoods, and homes due to the effects of global warming.
“The latter has been predicted for a long time, but today it is a common phenomenon. Twenty years ago, climate change was about analysing trends in data sets. Today, to observe climate change, one can just look out of the window. In the past 10 years, climate change has become a reality,” says Prof Franke.
Although carbon dioxide is one of the biggest contributors to global warming, it has an important role to play in soil health.
Soil as a major sink of carbon
As plants absorb the carbon dioxide from the atmosphere, enormous amounts of carbon are stored as organic soil matter in the upper two metres of soil. Prof Franke says carbon in the top two metres of soil is 200 times more than the amount that is annually emitted by human activities and three times the amount that is present in the atmosphere or vegetation.
“Carbon in soil plays an important but underestimated role,” he says. He believes that through proper soil management, humans can control the amount of carbon in the atmosphere. In the long term, this could have a positive effect on climate change.
“Our ultimate aim it to get sufficient amounts of carbon in the soil,” says Prof Franke. His department is involved in several studies to understand soil carbon and carbon sequestration processes.
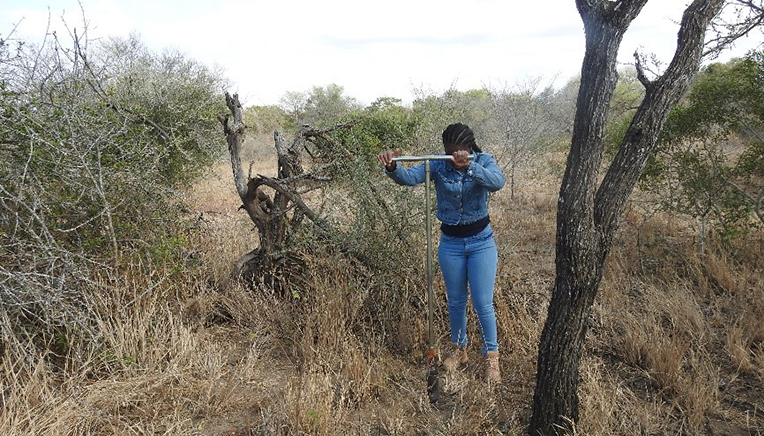
Odwa Malongweni collecting a soil sample from exclosures in the Kruger National Park.(Photo: Supplied)
Prof Johan van Tol, Associate Professor in the same department, and postgraduate students are conducting research in the Kruger National Park and the Drakensberg, where they are investigating the best ways to preserve carbon and increase the soil carbon levels.
He is of the opinion that there are two viable options for storing carbon removed from the atmosphere: the soil and the oceans. “Of the two, storing carbon in the soil is more realistic for most people and companies, as ownership and management of this natural resource can be determined. The potential for storing carbon in the soil is vast, yet poor soil management has led to carbon emissions equal to that of burning oil and coal reserves. Good soil management and restoration of degraded soils, on the other hand, can result in considerable sequestration of atmospheric carbon,” he says.
According to him, soil and environmental factors determine the carbon storage potential of the soil. He says in the mountainous soils of the Maloti-Drakensberg (MD), the cool climate and high rainfall have resulted in carbon-rich soils. “This area is generally considered a ‘carbon hotspot’, yet little is known about the carbon dynamics of these soils.”
Preliminary results from a project by two of his postgraduate students, Cowan Mc Lean and Jaco Kotze, titled Characterisation of carbon stocks, microbial diversity and degradation of the soils of the Amphitheatre summit, Northern Drakensberg, show that average carbon stocks of the soils are high to very high in the alpine wetlands. They found that poor land management (overgrazing) has resulted in soil and land degradation (e.g., erosion, draining of wetlands, and loss of vegetation and biodiversity).
“The degraded soils are no longer a ‘sink’ of atmospheric carbon, but become a ‘source’ that releases carbon,” he states.
He says drastic action is required to restore and protect these important carbon hotspots.
Today, to observe climate change, one can just look out of the window. In the past 10 years, climate change has become a reality. – Prof Linus Franke
In a study in the Kruger National Park, PhD students Tercia Strydom and Odwa Malongweni are investigating the impact of fires and herbivores on soil quality, including carbon contents. “They found that soil carbon is significantly impacted by fire and herbivores. The changes in vegetation structure due to fire and herbivores are likely to be the key driver of changes in carbon stocks,” says Prof Van Tol.
An agricultural perspective
Prof Franke considers carbon as an essential element for farming. “It is important for a healthy farming system,” he says.
He is conducting a study on high-density grazing, funded by the
Regional Universities Forum for Capacity Building in Agriculture. The on-farm performance of different grazing management systems, including selective and high-density grazing, with special reference to the spatial and temporal dynamics of soil carbon, is investigated in this study.
The research indicates that the grassland biome of South Africa covers about 20% of South Africa’s land surface, with more than half of the biome converted to arable land or greatly disturbed by urban development mining activities. The remaining tracks of the grassland biome are mostly used for livestock grazing on natural grassland.
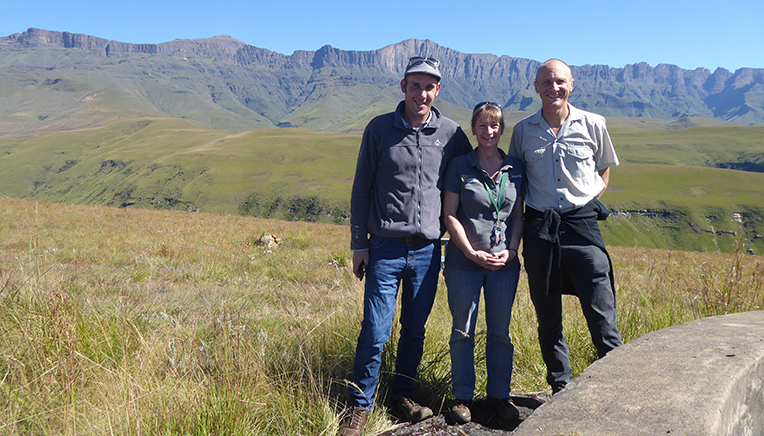
Prof Johan van Tol, Sue van Rensburg from the South African Environmental Observation Network, and Prof
Linus Franke in the Drakensberg. (Photo:Supplied)
He says there are different grazing management strategies of natural grasslands. “In continuous grazing systems, animals are given the opportunity to graze all season long with minimal interference. Rotational grazing systems incorporate periodic deferments, allowing field vegetation to recover in the period when grazing is absent.
“The more recent strategy of high-density grazing uses large herds, often double or triple the normal stocking densities for an area, grazing intensively on small areas of land for a short period of time, followed by a long resting period of the field.”
“High-density grazing is claimed to improve rangeland productivity by improving soil health, increasing soil carbon stocks to an extent that the emissions of greenhouse gases by livestock may be compensated by soil carbon sequestration, and improving the condition of the vegetation, while enhancing animal productivity on a per area basis. The adoption of high-density grazing can have major impacts on the sustainability and the economics of livestock production. An aim of the research is to quantify to what extent the claims of increasing soil carbon levels under high-density grazing realise under on-farm conditions,” explains Prof Franke.
He trusts that the knowledge generated in this project will be helpful to the broader agricultural sector, providing knowledge on carbon cycling, environmental sustainability, and opportunities for climate change mitigation in the livestock production sector.
Prof Franke is convinced that the protection of grasslands against degradation, while ensuring sufficient, reliable, and sustainable food production, are absolute key components driving the national and global development agenda.
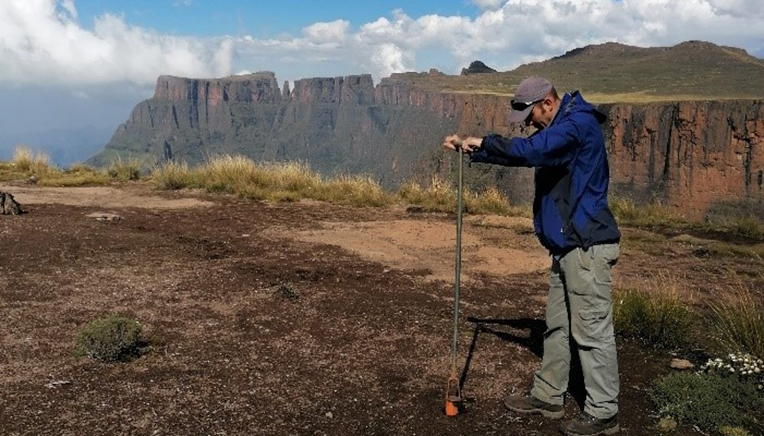
Prof Johan van Tol taking a soil sample on top of the Drakensberg. (Photo: Supplied)