Latest News Archive

Please select Category, Year, and then Month to display items
Previous Archive
12 October 2020 | Story Leonie Bolleurs | Photo Supplied
Adriaan van der Walt
Although several international studies have used temperature metrics to statistically classify their seasonal divisions, a study in which Adriaan van der Walt was involved, would be the first known publication in a South African context using temperature as classification metric.

Gone are the days when we as South Africans would experience a three-month spring season, easing into summer, and then cooling off for three months before we hit winter.

Adriaan van der Walt, Lecturer in the Department of Geography at the University of the Free State (UFS), focuses his research on biometeorology (a specialist discipline exploring the role and climate change in physical and human environments) as well as climatology and geographic information systems.

He recently published an article: ‘Statistical classification of South African seasonal divisions on the basis of daily temperature data’ in the South African Journal of Science.

In this study, which Van der Walt undertook with Jennifer Fitchett, a colleague from the University of the Witwatersrand, data on daily maximum and minimum temperatures was collected from 35 meteorological stations of the South African Weather Service, covering the period between 1980 and 2015.

They went to great lengths to ensure that they had a complete set of data before presenting it to demonstrate seasonal brackets.

First for South Africa

Their statistical seasonal brackets indicate that South Africans now experience longer summers (from October to March), autumn in April and May, winter from June to August, and spring in September.

Although considerable work has been done using rainfall to determine seasonality in Southern Africa, Van der Walt believes that these methods did not work well as there are too many inconsistencies in this approach, as identified by Roffe et al. (2019, South African Geographical Journal). To make matters more complicated – as a semi-arid region, and with desert conditions along the west coast – some regions do not have enough rainfall to use as a classifier.

Temperature, on the other hand, worked well in this study. “Temperature, by contrast, is a continuous variable, and in Southern Africa has sufficient seasonal variation to allow for successful classification,” says Van der Walt.

He continues: “Although several international studies used temperature metrics to statistically classify their seasonal divisions, this study would be the first known publication in a South African context using temperature as classification metric.”

Van der Walt says what we understand as seasons largely relates to phenology – the appearance of blossoms in spring, the colouration and fall of leaves in autumn, and the migration of birds as a few examples. “These phenological shifts are more sensitive to temperature than other climatic variables.”

Seasonal brackets

According to Van der Walt, they believe that a clearly defined and communicated method should be used in defining seasons, rather than just assigning months to seasons.

“One of the most important arguments of our work is that one needs to critically consider breaks in seasons, rather than arbitrarily placing months into seasons, and so we welcome any alternate approaches,” he says.

A number of sectors apply the temperature-based division to their benefit. “For example, in the tourism sector it is becoming increasingly important to align advertising with the season most climatically suitable for tourism,” says Van der Walt.

Temperature-based division is also used to develop adaptive strategies to monitor seasonal changes in temperature under climate change. However, Van der Walt points out that each sector will have its own way of defining seasons. “Seasonal boundaries should nevertheless be clearly communicated with the logic behind them,” he says.

News Archive

#Women'sMonth: Long hours in wind and cold weather help to reconstruct Marion Island’s glacial history
2017-08-10

 Description: Liezel Rudolph  Tags: Liezel Rudolph, Process Geomorphology, Marion Island, periglacial geomorphology, Department of Geography  

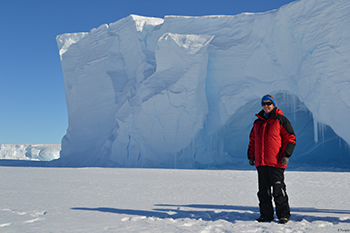
Liezel Rudolph, lecturer for second-year students in Process
Geomorphology at the University of the Free State (UFS).
Photo: RA Dwight

Liezel Rudolph, a lecturer for second-year students in Process Geomorphology, aims to reconstruct the glacial history of Marion Island through cosmogenic nuclide dating techniques. She is interested in periglacial geomorphology, a study of how the earth’s surface could be formed by ice actions (freezing and thawing of ice).

Liezel is a lecturer in the Department of Geography at the university and is researching landscape development specifically in cold environments such as Antarctica, the Sub-Antarctic islands, and high mountain areas. “My involvement with periglacial geomorphology is largely due to academic giants who have carved a pathway for South Africans,” says Liezel.

Liezel visited Marion Island for the first time during her honours year in 2011, when she investigated the impact of seals on soil conditions and vegetation. Three years later, she visited Antarctica to study rock glaciers.

The challenge of the job
A workday in Antarctica is challenging. “Our time in the field is very limited, so you have to work every possible hour when the weather is not life-threatening: from collecting soil samples, to measuring soil temperature and downloading data, we measure polygons and test the hardness of rocks. The only way to get the amount of work done, is to work long hours in wind and rain with a positive and competent team! We take turns with chores: the person carrying the notebook is usually the coldest, while the rest of us are stretching acrobatically over rocks to get every nook and cranny measured and documented.”

A typical workday
Liezel describes a typical workday: “Your day starts with a stiff breakfast (bacon and eggs and a bowl of oats) and great coffee! After that comes the twenty-minute dressing session: first a tight-fitting under-layer, a middle layer – sweater and T-shirt, and then the outer windbreaker (or a quilt jacket on an extra cold day). Then you start applying sunscreen to every bit of open face area. Beanie on, sunglasses, two pairs of socks, two pairs of gloves. The few kilograms of equipment, one vacuum flask containing an energy drink, one vacuum flask containing drinking water (it would freeze in a regular bottle), and a chocolate bar and piece of biltong for lunch. After this, we drive (on snowmobiles) or fly (in helicopter) to our study area for about eight hours of digging, measuring, downloading, testing and chopping. Back at the base and after a long and tiresome undressing session, we move to the lab with all our data to make sure that it is downloaded safely and captured onto a database. Afterwards, depending on the day of the week, we enjoy a good meal. If you are lucky, such a typical day will coincide with your shower day. We can only shower every second day due to the energy-intensive water production (we have to melt snow) and the sewage system (all the water has to be purified before it could be returned to the environment). Then you grab your eye shield (since the sun is not sinking during summer) and take a nap before the sun continues to shine into the next day.”

Theoretical knowledge broadened 
“Going into the field (whether island or mountains) provides me with an opportunity to test geomorphic theories. Without experience in the field, my knowledge will only be limited to book knowledge. With practical experience, I hope to broaden my knowledge so that I could train my students from experience rather than from a textbook,” says Liezel.

We use cookies to make interactions with our websites and services easy and meaningful. To better understand how they are used, read more about the UFS cookie policy. By continuing to use this site you are giving us your consent to do this.

Accept